[DRAFT]
Problem formulation
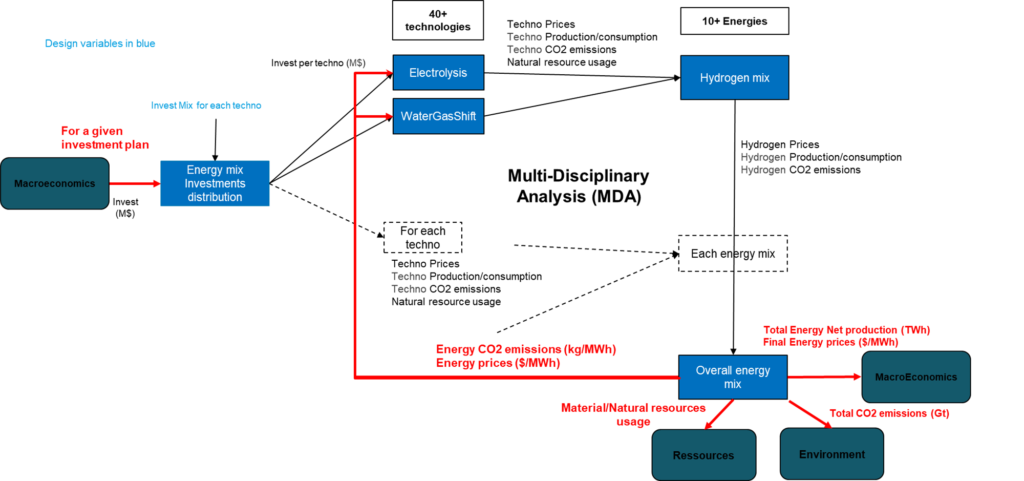
WITNESS framework provide a toolbox of models and pre-integrated ecosystems using them. It also provides powerful multi-disciplinary analysis and optimization capabilities (MDA/MDO).
Below is an example of MDO performed with the WITNESS framework, that can be summarized by:
| Objective | maximize welfare for a defined CO2 policy |
| Design Variables | technology investment mixes (from 2020 to 2100) |
| Constraints | (from 2020 to 2100): – total energy production > energy lower bound – net energies production > energies demand – liquid fuel + H2 prod + H2 liquid production > % total production – solid fuel + electricity + biomass production > % total production – hydropower production < hydropower production in 2020 – H2 liquid production > %H2 total production – available land > land demand (for forest, agriculture…. ) |
Objective
Two objectives were initially simultaneously targeted :
– Maximise welfare uses the notion of welfare, which is a mix of GDP, population and climate criteria
– Minimize CO2 emissions uses all CO2 emitted in energy and economy subsystems
But experience shows that the impact of climate damage on economy and its impact on welfare is enough to allow removing the second objective with same results (but simpler/faster resolution time, avoiding oscillations between conflicting trends).
As in DICE (Nordhaus, 2017), a utility model is used to determine welfare, but our way to compute utility per capita is slightly different from DICE : we multiply the value obtained in DICE by an energy price ratio.
Utility per capita is:
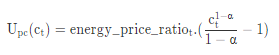 | with | 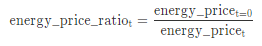 |
where energy_price is the mean price of energy in dollars per MWh and comes from the energy model, α is the elasticity of marginal utility (conso_elasticity). We set it by default to 2.
A higher α means that marginal utility decreases faster with increase in income
The DICE’s objective function is the social welfare, the discounted sum of utility:
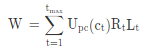 |
ct=Lt/Ct is the per capita consumption. Lt is the population in millions of people. Rt is the discount factor, a discount on the economic well-being of future generations (with ρ pure rate of social time preference) |
|
The discount rate is a very debated parameter as it can change drastically the results and no consensus exists on its value. This topic has been extensively analysed by Gaullier (2011).
Another objective value is calculated and set as an output of the utility model, based on the minimum value of the discounted utility:
|
γ is a trade variable between the objectives based on the economy. α is the global trade off variable between global warming and the economy. |
Design variables
What is optimized is the split of available investment from economy, over all available energy production technologies.
This split is optimized over years from now to end of the century, toward the best result vs the objective explained above.
The objective function is shown below and itself embed a multi-disciplinary analysis mechanism to provide for a given investment split, the net produced energy, the total CO2 emitted, and the total consumption of resources (fossil resource, land use, water use…).
Constraints
A minimum energy is needed to keep minimum economy, to avoid optimizer to fully stop economy for several years to brutally reduce emissions – which would makes no senses.
Net energy production is the total energy produced minus the energy used to produce another energy (e.g. electricity used to produce hydrogen is not available for economy, it “stays” within the energy sub-system).
The constraint impose that the Net energy produced must match the Economy system energy demand.
Simulate the fact that part of the energy needed must be liquid : at that stage a fixed % of total production that must fulfill this constraint is provided as input. That could be improved in the future…
Simulate the fact that heating buildings today is based on these so we need to match a fixed % of total production in that category. That could be improved in the future…
Avoid solution that would be too water greedy considering the trend is to have less and less water available for industrial energy production due to climate change.
Check that we don’t assume we use more land than we actually have available.
Results
Results can be analysed live on OS-Climate hosted SoSTrades platform where WITNESS is available.
Distribution of investments on each energy per year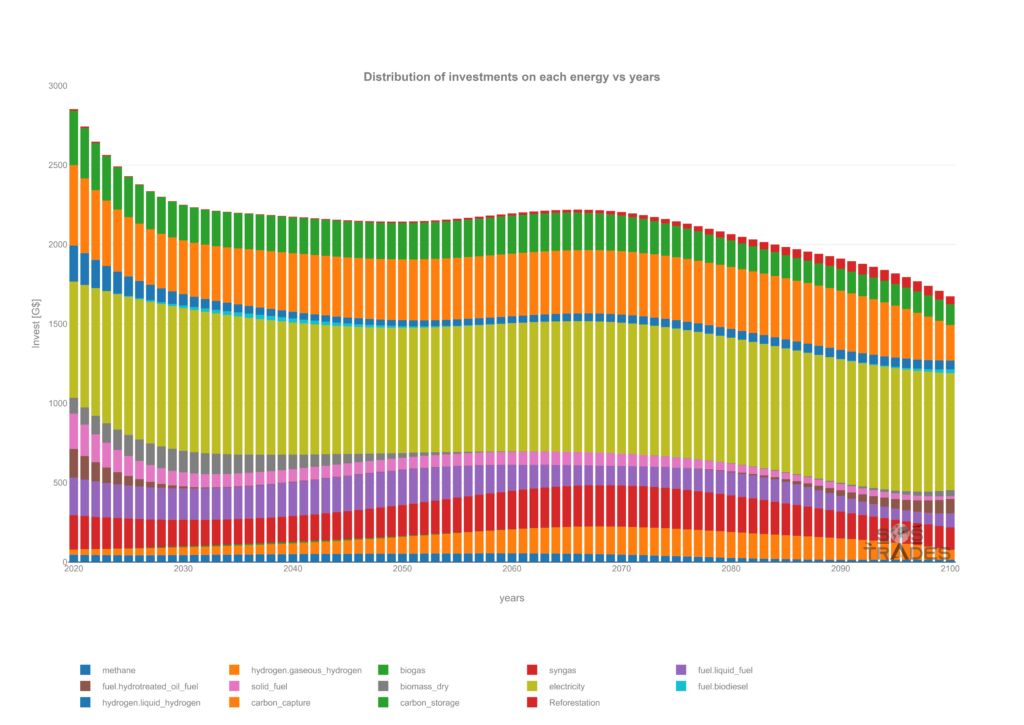 | Welfare evolution over years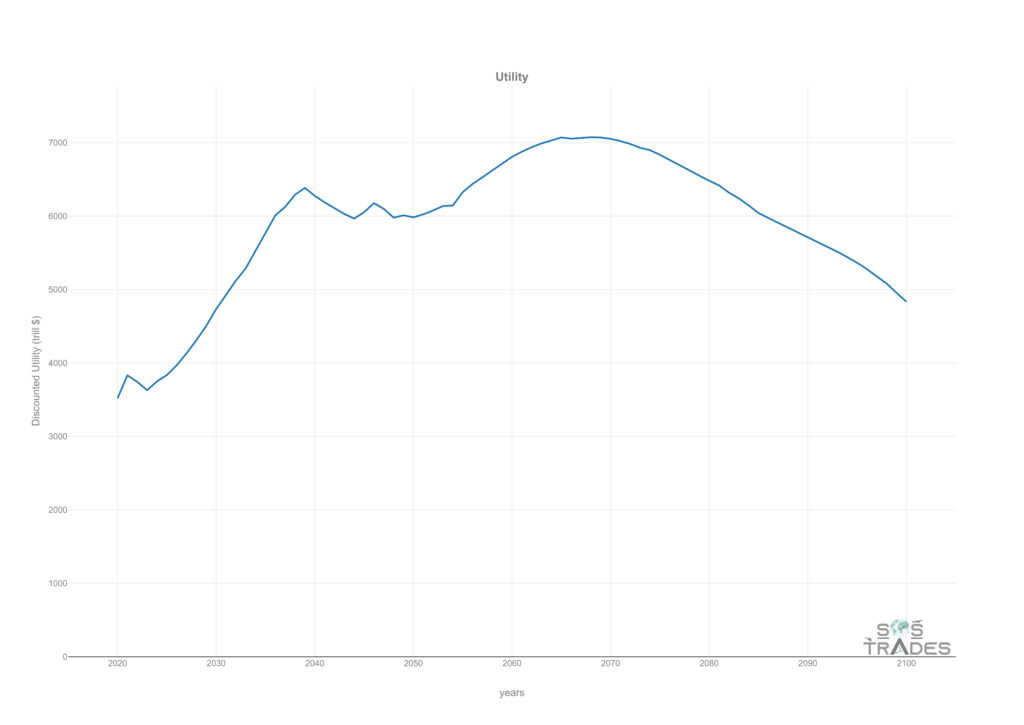 |
CO2 emissions breakdown over years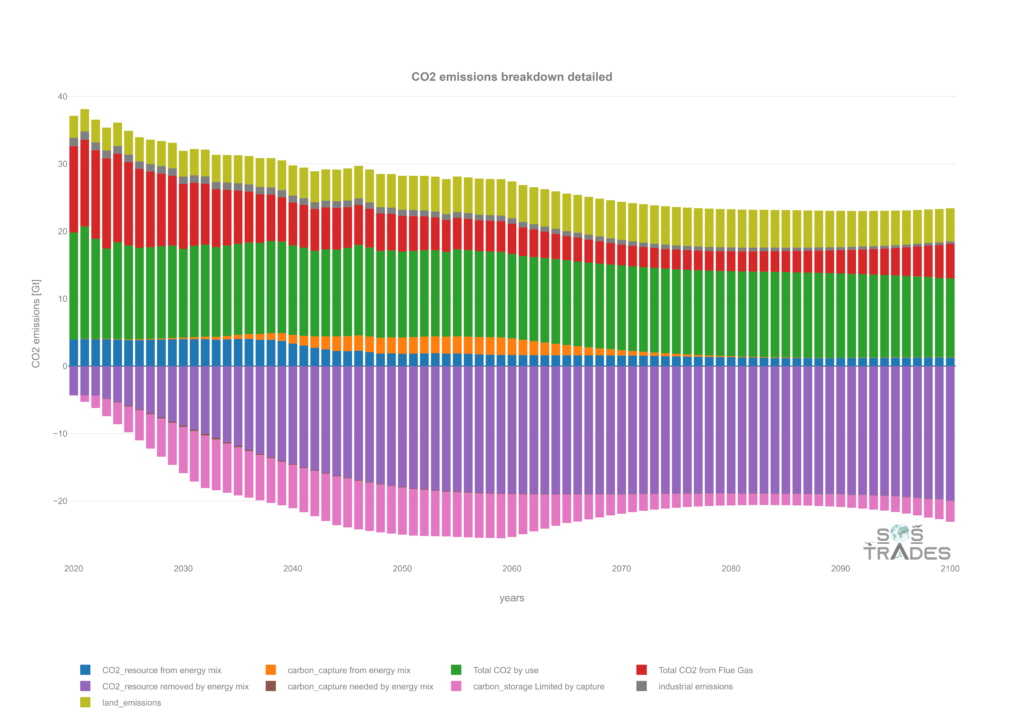 | Environmental damage over years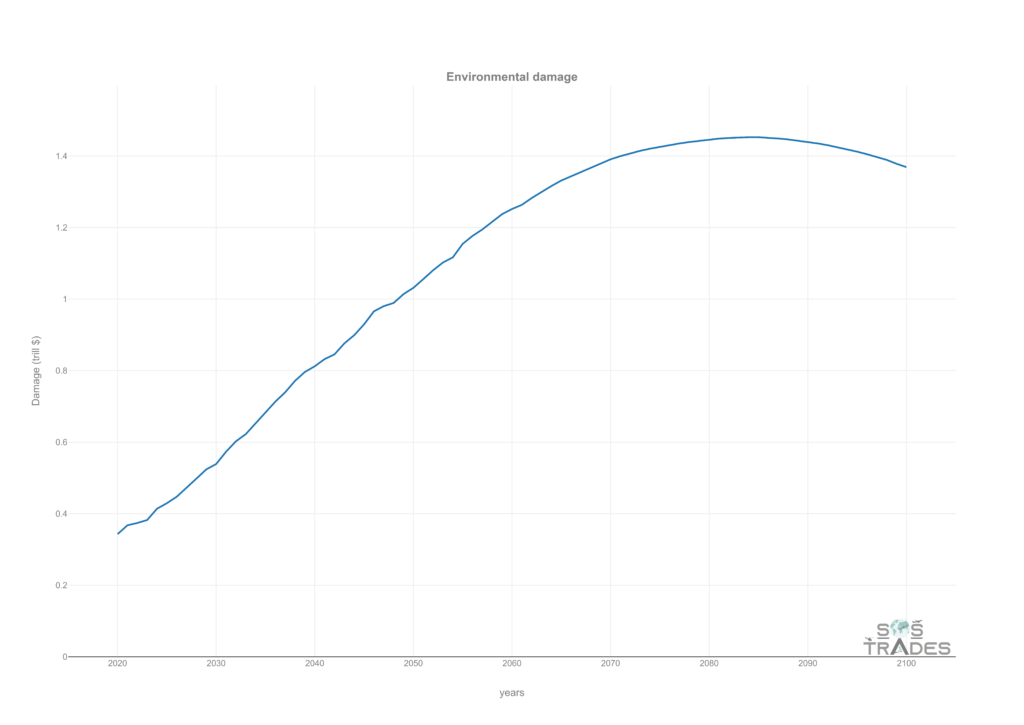 |
Global CO2 breakdown over years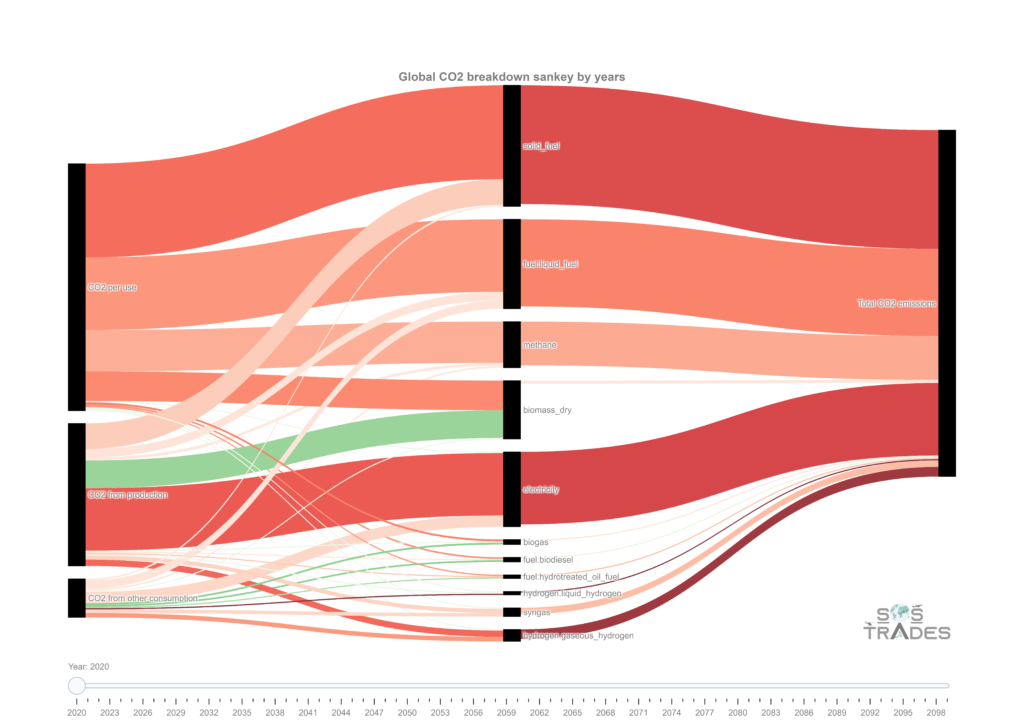 |  |
Applications
The above example shows you can have some subparts of the WITNESS model that optimally tune themselves according to provided objectives. You can mix that with more driven explorations.
For example, you can use WITNESS to answer such questions as :