Definition (extracted from ^1)
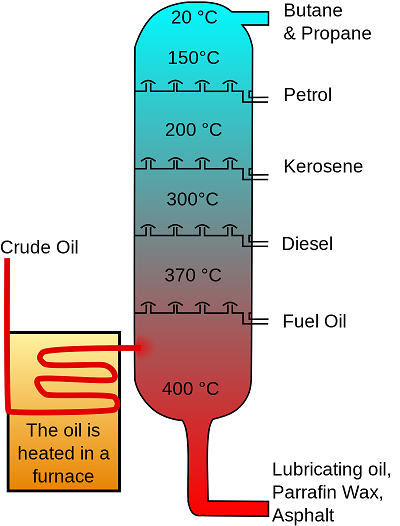
An oil refinery or petroleum refinery is an industrial process plant where crude oil is transformed and refined into useful products such as petroleum naphtha, gasoline, diesel fuel, asphalt base, heating oil, kerosene, liquefied petroleum gas, jet fuel and fuel oils.
 (Image Credit: Psarianos, Theresa Knott, taken from ^1 )
Crude oil breakdown
The first and second column of the following table gives the breakdown of 1 kg of crude oil: ^2
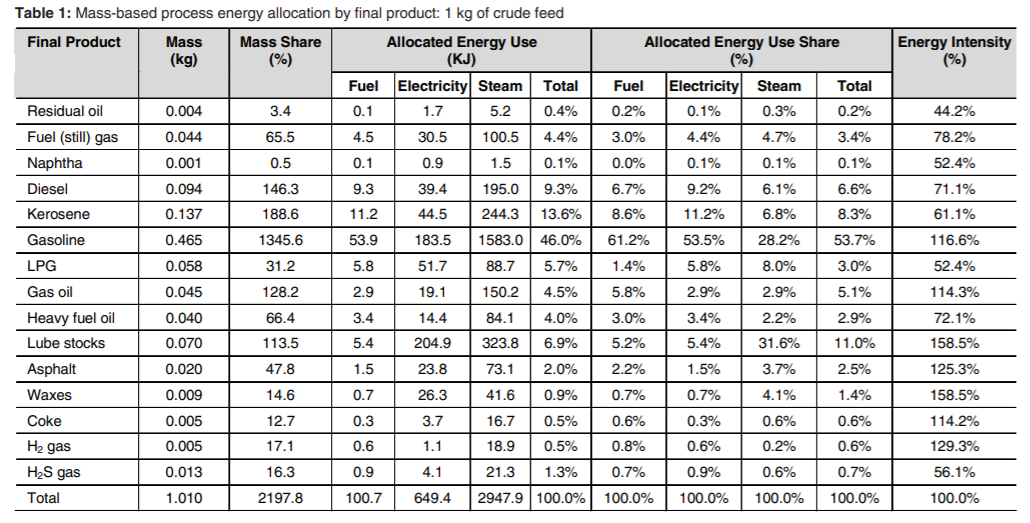
Products with similar properties can be gathered in the following categories:
Gasoline (~46%)
It is used primarily as a fuel in most spark-ignited internal combustion engines. The characteristic of a particular gasoline blend to resist igniting too early (which causes knocking and reduces efficiency in reciprocating engines) is measured by its octane rating, which is produced in several grades. The higher the octane rating is, the better the resistance to auto-ignition will be, and the longevity of engine preserved. The following data are used : Calorific value = 12.06 kWh/kg CO2 emission per kg burnt = 3.6 kgCO2/ kg of gasoline burnt Density = 750 kg/m^3
The average price of gasoline around the world is 4.21 USD per US gallon in 2021^3. However, there is substantial difference in these prices among countries. As a general rule, richer countries have higher prices while poorer countries and the countries that produce and export oil have significantly lower prices.
Kerosene (~13%)
Also known as paraffin, it is a combustible hydrocarbon liquid which is widely used as a fuel in aviation as well as households.
Kerosene boils at 150°C – 250°C and, like diesel, belongs to the medium density distillate class. It is lighter than diesel, but heavier than gasoline. Because of its extreme operating conditions at high altitude (low temperatures and air pressure), it must comply with particularly strict quality requirements.
The combustion reaction can be approximated as follows, with the molecular formula C10H22:
Using molar masses, we see that there is a 3.15 factor in CO2 emissions for kerosene. Calorific value is around 11.9 kWh/kg and density around 821 kg/m^3.
The average price of kerosene around the world is 2.8 USD per US gallon in 2021 ^3.
Ultra low sulfur diesel and diesel (~10%)^4
These are diesel products fo crude oil refinery. Ultra low sulfur diesel is diesel that emits less particules when burnt. Diesel is mainly used as motor fuel.
Calorific value = 11.83 kWh/kg Density = 850 kg/m^3 The average price of gasoline around the world is 3.77 USD per US gallon in 2021^3.
Heating oil (~9%)^5
This regroup gas oil, fuel gas and naphtha. As indicated by the name, the use is heating. As heating oil are chimically close to diesel, it can be used as motor fuel too. The following data are used : Calorific value = 12.47 kWh/kg CO2 emission per kg burnt = 2.82 kgCO2 / kg of heating oil burnt Density = 740 kg/m^3
Liquefied Petroleum Gas (~6%)^6
In short, LPG, is a mix of hydrocarbon gas. It is made up of propane (48%), butane (50%) and pentane (2%). It can be used as fuel, refrigerator gas and also domestic gas.LPG can also be converted into a high quality gasoline. The following data are used : Calorific value = 12.8 kWh/kg CO2 emission per kg burnt = 2.82 kgCO2/ kg of LPG burnt Density = 535.66 kg/m^3 The average price of LPG around the world is 2.49 USD per US gallon in 2021^3.
There are other products that are not taken into account because they are not used as energy. That includes for example wastes, waxes, and heavy fuel oil which is residual fuel.
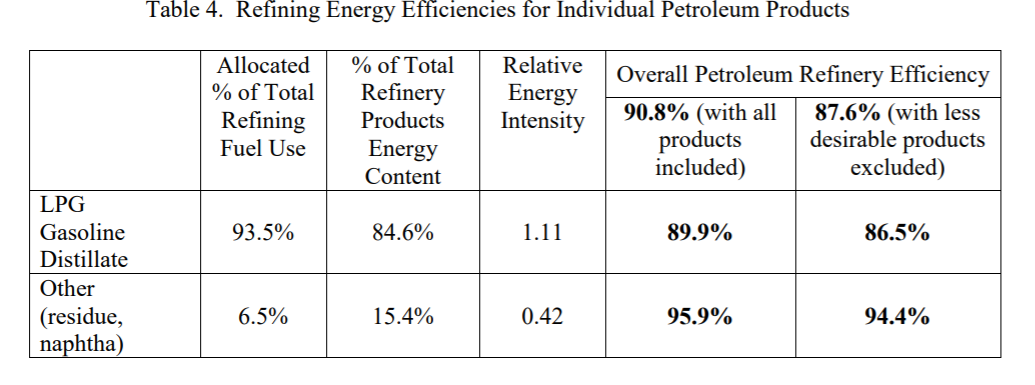
Efficiency
As shown in the study ^7, overall petroleum oil refinery efficiency is around 0.89.
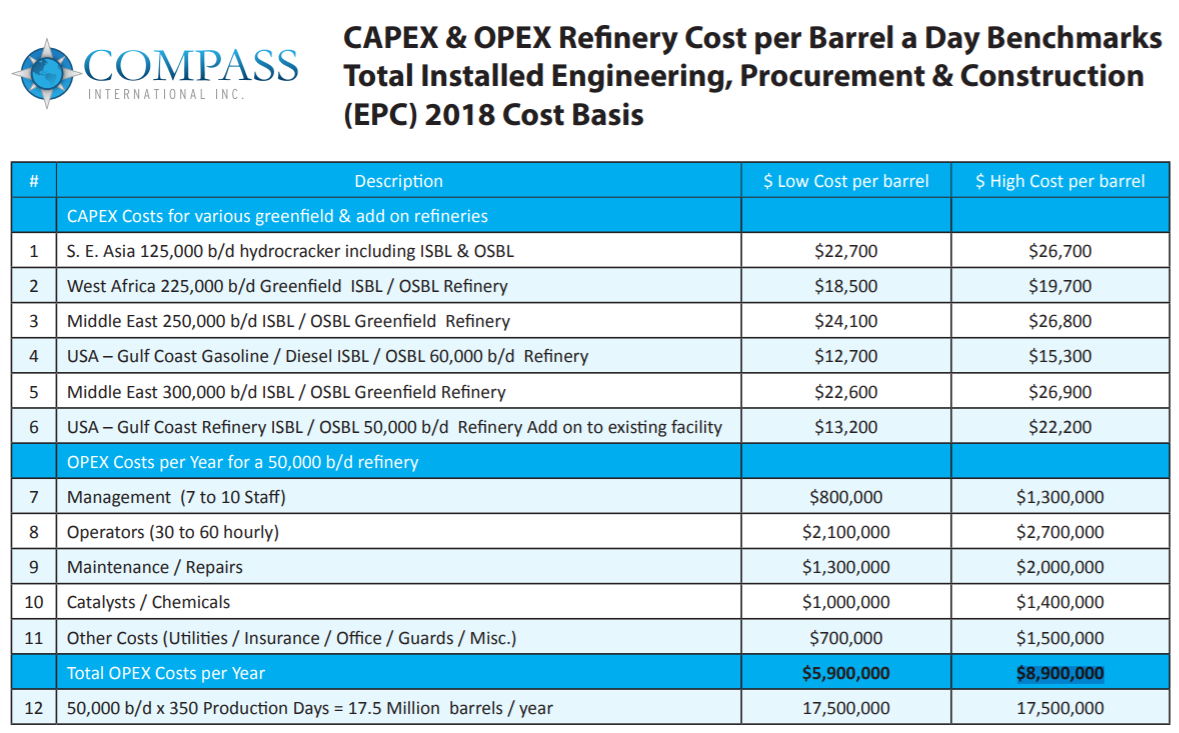
CAPEX & OPEX
We took 22000 USD per barrel and an OPEX percentage of 0.04, extracted from the following document [^8]:
GHG emissions
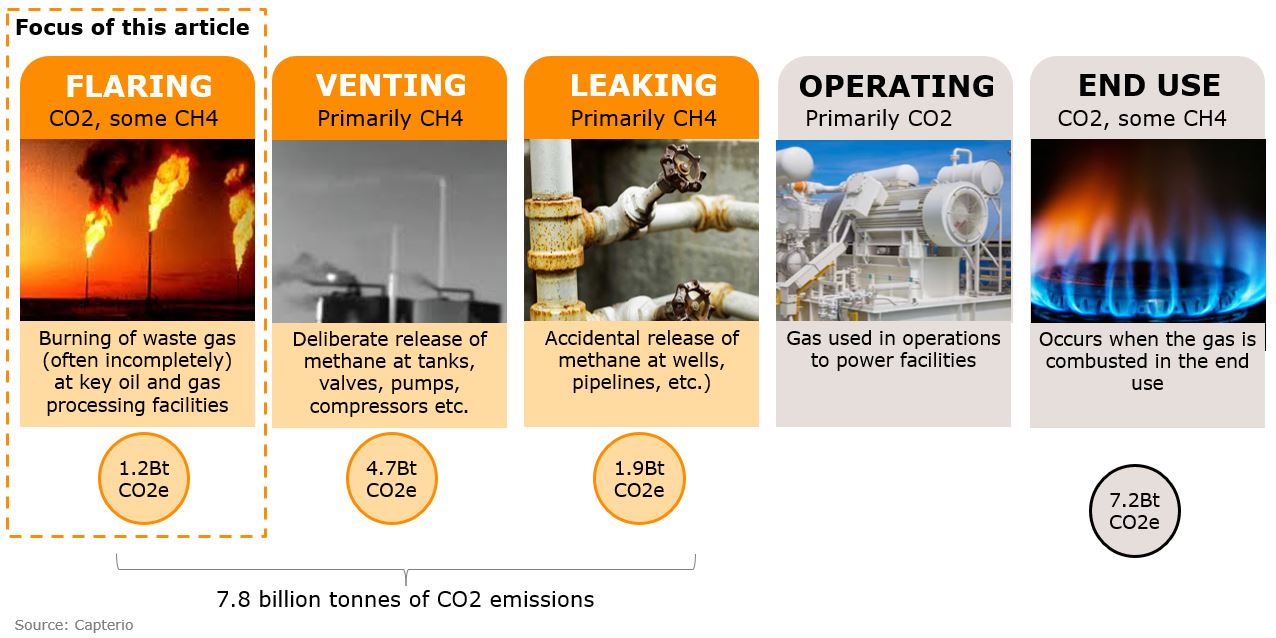
The GAINS model predicts methane fugitive emissions from crude oil extraction. Methane is emitted during each phase of oil extraction. During flaring, the waste gas out of oil facilities is burned and emits some CH4 emissions. Some other methane emissions occur during venting which consists at releasing methane directly to the atmosphere during the oil development process (wall completion, tank maintenance ...). Finally unintended leakage is also taken into account in this model for methane emissions. Emission factors from oil extraction are adapted from IEA data in the IEA Methane Tracker 2021 [^12] and compared with the Supplement data of the Hoglund Isaksson paper [^10].
 (source^11)
Hydrogen Consumption
Refineries use hydrogen to lower the sulfur content of diesel fuel. Refinery demand for hydrogen has increased as demand for diesel fuel has risen both domestically and internationally, and as sulfur-content regulations have become more stringent. Oil refining is the largest consumer of hydrogen today (close to 40 Mt in 2020), and will remain so in the short to medium term. Hydrogen used in this sector is normally produced onsite by steam methane reforming, separated from by-product gases from petrochemical processes or sourced externally as merchant hydrogen (typically produced in dedicated plants for hydrogen production using steam methane reforming).[^9]
^1: Oil Refinery Wikipedia page, https://en.wikipedia.org/wiki/Oil_refinery ^2: Allocation of Energy Use in Petroleum Refineries to Petroleum Products, Center for Transportation Research, https://citeseerx.ist.psu.edu/viewdoc/download?doi=10.1.1.200.6273&rep=rep1&type=pdf ^3: Global prices for oil products, https://www.globalpetrolprices.com/ ^4: ULSD Wikipedia page, https://en.wikipedia.org/wiki/Ultra-low-sulfur_diesel ^5: Heating Oil Wikipedia page, https://en.wikipedia.org/wiki/Heating_oil ^6: LPG Wikipedia page, https://en.wikipedia.org/wiki/Liquefied_petroleum_gas ^7: Updated Estimation of Energy Efficiencies of U.S. Petroleum Refineries, Transportation Research Argonne National Laboratory, https://publications.anl.gov/anlpubs/2011/01/69026.pdf [^8]: CAPEX & OPEX Refinery Cost per Barrel a Day Benchmarks Total Installed Engineering, Procurement & Construction (EPC) 2018 Cost Basis, Compass International, https://www.compassinternational.net/wp-content/uploads/2018/02/TR_Capex.pdf [^9]: IEA 2022, Hydrogen Report, https://www.iea.org/reports/hydrogen, License: CC BY 4.0.
[^10]: Höglund-Isaksson, L., 2017. Bottom-up simulations of methane and ethane emissions from global oil and gas systems 1980 to 2012. Environmental Research Letters, 12(2), p.024007. SUpplement data : https://cfn-live-content-bucket-iop-org.s3.amazonaws.com/journals/1748-9326/12/2/024007/revision2/erlaa583e_suppdata.pdf?AWSAccessKeyId=AKIAYDKQL6LTV7YY2HIK&Expires=1652945090&Signature=D76U3FEx6%2BOH05mxJ5wXWbpSrTQ%3D
[^12]:IEA Methane Tracker 2021, (https://www.iea.org/articles/methane-tracker-data-explorer), License: CC BY 4.0.