Agricultural lands
Agricultural lands are divided in 2 type of fields that are mixed in this model. Crops for cereal, vegetables or other production, and grazing lands for switchgrass or other products.
The area available for crops is 1.1Gha and for grazing lands 3.8 Gha for a total around 4.9Gha[^1].
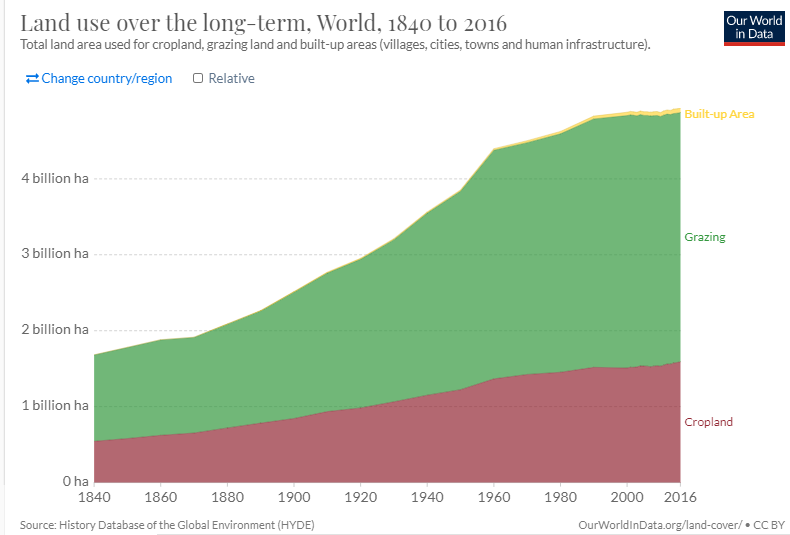 (source: ourworldindata[^1])
Agricultural products
This model computes the biomass dry producted with crops for energy.
crop residues
In a field, 50% of the harvest is left, this is what is called crop residues. The field residues are left on the field (to minimize the erosion of soil by wind and water), and the process residues are from the processing of the crops in usable resources (for esample husks, seeds, bagasse, molasses and roots). 25% of residues can be used as biomass for energy[^2]. The biomass potential from crops residues for energy is high but not yet fully exploited. The residue potential is between 4900Twh (17.8EJ) to 22000Twh(82.3EJ)[^3], but in reality, biomass from agriculture is around 1555Twh(5.6EJ)[^4].
The removed residues from the field must be compensated with fertilizers.
crops
As most of the crops are for the food industry (human or animal), some of it is used for the energy sector, it is called energy crop. Only 0.1% of the total biomass production are from energy crops[^5].
The crop production is computed from an average crop yield at 2903kg/ha with 4070kg/ha for 1.1Gha of crop fields[^6] and an average crop yield of 2565.68kg/ha for 3.8Gha of grazing lands. The total yield (crop + 25% residue) is:
The crop energy production computed corresponds in a mix of crops and residue available for energy. The crop production dedicated to industry (food or other) has been removed.
Agricultural sectors
Crops model computes the place needed to feed the humanity and how much crops can be used for energy.
Land for food
Food is one of the primary needs of human being. However, it is also a real challenge to produce food with the limited space of the land on our planet, and the important population. The agriculture model aims to answer to the following question: Given a food diet for humanity, how much space do we need to to feed everyone ? This model allows to test different food diets, and computes the agriculture surface needed to produce enough food to feed all human beings.
crops for energy
crops for energy must not be in competition with feeding the humanity. The production of biomass dry by crops for energy is computed with a given investment and the remaining surface.
Model data
This section lists the inputs and outputs of the model.
The model inputs are: * year start, this defines the starting year of the study. * year end, this defines the last year of the study. * population_df, this gives the population number, for each year of the study. The unit is the million of people. * temperature_df, gives the temperature in degree Celsius above pre-industrial level for each year of the study. * starting diet, this gives the food diet for the first year of the study. For each food, the quantity in kg/person/year need to be filled. The different food taken into account are: red meat, white meat, milk, eggs, rice and maize, potatoes, fruits and vegetables. By default, data are:
|Red meat|White meat|Milk|Eggs|Rice and Maize|Potatoes|Fruit and vegetables|Unit| | ------ |:--------:|----|----|:------------:|:------:|:------------------:|----| |11.02|31.11|79.27|9.68|97.76|32.93|217.62|kg/person/year|
These data are the average world diet [^7].
- m2 per kg, gives the average area needed to produce 1kg of the considered food. The unit is m^2/kg. By default, data comes from [^8].
- kcal per kg, gives the number of kilocalories for 1kg of the considered food. The unit is kcal/kg. By default, the values are:
|Red meat|White meat|Milk|Eggs|Rice and Maize|Potatoes|Fruit and vegetables|Unit| | ------ |:--------:|----|----|:------------:|:------:|:------------------:|----| |2566|1860|550|1500|1150|670|624|kcal/kg|
These data are extracted from [^9]. * red meat calory percentage, gives the percentage of red meat kcal in a person's diet. * white meat calory percentage, gives the percentage of white meat kcal in a person's diet. * other_use_agriculture, gives the average ha per person for the use of agriculture in other way that the 7 food types. It mainly takes into account : cocoa - coffee - olive - sugar - oil(palm, sunflower,...) - tea - grapes(wine) - tobacco - yams - natural rubber - millet - textile fiber (cotton and other)... By default, it is set to 0.102ha/person to represent around of 800 millions of ha for a population of 7.8billions of people. [^10]
- CO2_from_production: Represent the CO2 emitted while the biomass dry production. CO2 is absorbed by the plants in order to be zero emissions in the end. Emissions from tractors are taken into account in the raw to net energy factor,
- CO2_from_production_unit: Unit of the CO2_from_production value. In kgCO2/kgBiomassDry by default,
- Capex_init: CAPEX of crop exploitation. See details on costs,
- Opex_percentage: OPEX of crop exploitation. See details on costs,
- lifetime: lifetime of an agriculture activities, initilized to 50 years,
- residue_density_percentage: percentage of residue, at 0.25 by default,
- density_per_ha: density of crop product by hectare, at 3628.75 kg/ha by default,
- density_per_ha_unit:unit of the density of crop, at kg/ha by default,
- crop_percentage_for_energy: crop percentage for energy, at 0.001 by default
- residue_percentage_for_energy: residue percentage for energy, at 0.1 by default
- crop_residue_price_percent_dif: ratio between the average price of residue price (23$/t) on average crop price (60$/t), 38% by default.
- construction_delay: laps of time before the first harvest, at 1 year by default
- crop_investment: investment for crops for energy
- initial_production: crop production for energy in 2020
The model outputs are:
- agriculture productivity evolution, gives the evolution of agriculture productivity overtime, due to climat change. Unit is %.
- food land surface, gives the surface needed to produce the amount of food of the diet. The unit is Gha.
- food land surface percentage, gives the share of the surface of each type of food, in %.
- final diet, gives the diet evolution over the years, in kg/person/year, for each type of food.
- Total food land surface, gives the total amount of land needed for food, in Gha.
- CO2 Emissions: CO2 emissions from crop production and residues for energy sector
- CO2 land Emissions: CO2 land emissions from food production and crop energy production that will be transferred to the carbon emission model
- CH4 land Emissions: COH4 land emissions from food production and crop energy production that will be transferred to the carbon emission model
- Required land surface: Surface of crop energy and food land
- biomass dry production: crop production for energy sector with residues for energy sector
- biomass dry prices: detailed of prices
- Detailed mix prices: detailed average price of crop and residues
From a food diet to a surface
This section aims to explain how the model goes from a food diet to a surface to produce the required food.
The following picture shows the "how to" process.
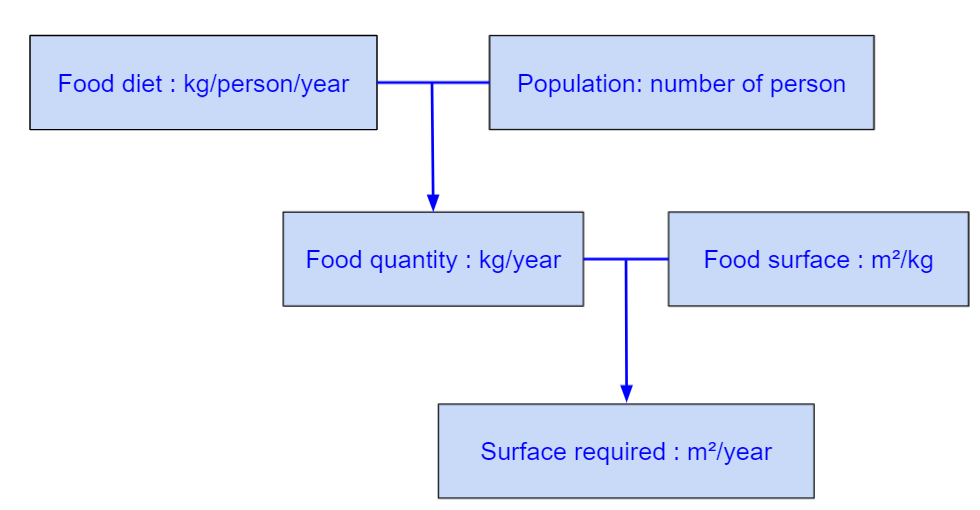
First, given the population and the diet per person, the quantity of food is deduced:
Then, knowing the conversion factor between mass of food and surface needed to produce it, the required surface is given by:
To all of this, an other contribution will be added to the agriculture surface. This other contribution represents the use of agriculture for other purpose than producing the 7 food types already taken into account. It mainly takes into account : cocoa - coffee - olive - sugar - oil(palm, sunflower,...) - tea - grapes(wine) - tobacco - yams - natural rubber - millet - textile fiber (cotton and other) - wheat...
Changing the diet
This section aims to explain how the diet change works in the agriculture model.
In this model, the user is able to change diet over time, then, to observe the effect of the changes. First of all, when a diet change, one of the risk is to be undernourished. To prevent that, the diet will remain at the same amount of kcal all the time. When the term "convert" a food X to an other Y is used, it means suppress a quantity of food X, which corresponds to an amount of E kcal, and then add a amount of food Y that fill the E kcal removed.
The model starts from the base-diet given in input, diet_df. The first change is to convert red meat and white meat, using red_meat_percentage and white_meat_percentage to vegetables (fruit and vegetables, potatoes and rice and maize). This will give the percentage converted, based on the base-diet. For red_meat_percentage = 6.86%, nothing will change, it is the same as the starting diet. For red_meat_percentage = 0%, all red meat is removed, and missing kcal are filled by additional vegetables. The red meat percentage must be between 10% and 1%. The white meat percentage must be between 20% and 5%. Eggs and milk are not impacted.
The following picture shows the different steps.
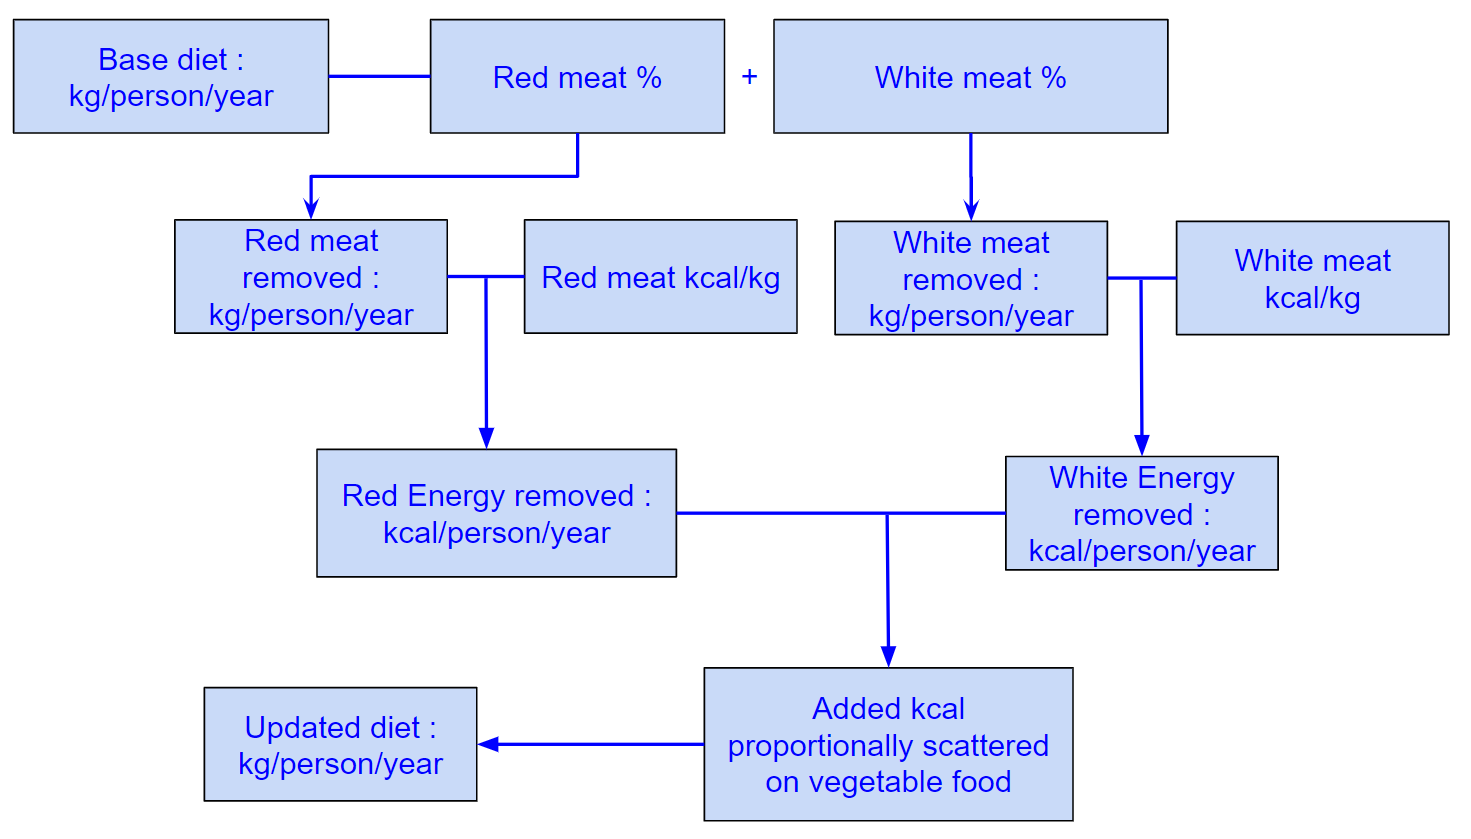
First, the new quantity of red meat is calculated:
This red_meat_removed corresponds to a quantity of kcal determined by:
Then, the new quantity of white meat is calculated:
This white_meat_removed corresponds to a quantity of kcal determined by:
Finally, the diet has to be updated with the conversion into vegetables: the amount of calory is proportionaly reported to the vegetables. for the 'fruit and vegetables' diet:
The same formula is applicated to the 'potatoes' and 'rice and maize' food categories.
Climate change impact
The increase in temperature due to global warming has consequences on crop productivity. Effects of global warming on agriculture are for example drought, flooding and increased crops water needs.
Some models estimate the impact of increased temperature on crop productivity but results are quite disparate.
We therefore chose to implement one impact for all agriculture productivity and not one per type of crop
(maize, rice, wheat...). Our bilbiography to define the effect includes IPCC[^11]
(Intergovernmental Panel on Climate Change), the FAO[^12] (Food and Agriculture Organization),
Carl-Friedrich Schleussner et al (2018)[^13] and Rosenzweig et al. (2014)[^14].
The surface required taking into account climate change is:
By default $\alpha$ and $b$ are respectively set at -0.00833 and - 0.04167. So that at +2 degrees (above pre industrial level) the decrease in productivity is 5% and 30% at +5 degrees celsius.
Then, when temperature rises, the surface required to produce the same amount of food increases by the share of production reduction.
Greenhouse Gas emissions of food production and crops are computed from ratios of kgCO2eq per kg of food from [^18] and scaled using FAO's food production in 2019 [^20].
A weighed kgCO2eq per kg of food is then computed for each modelled category of food products (red meat, white meat, etc...)
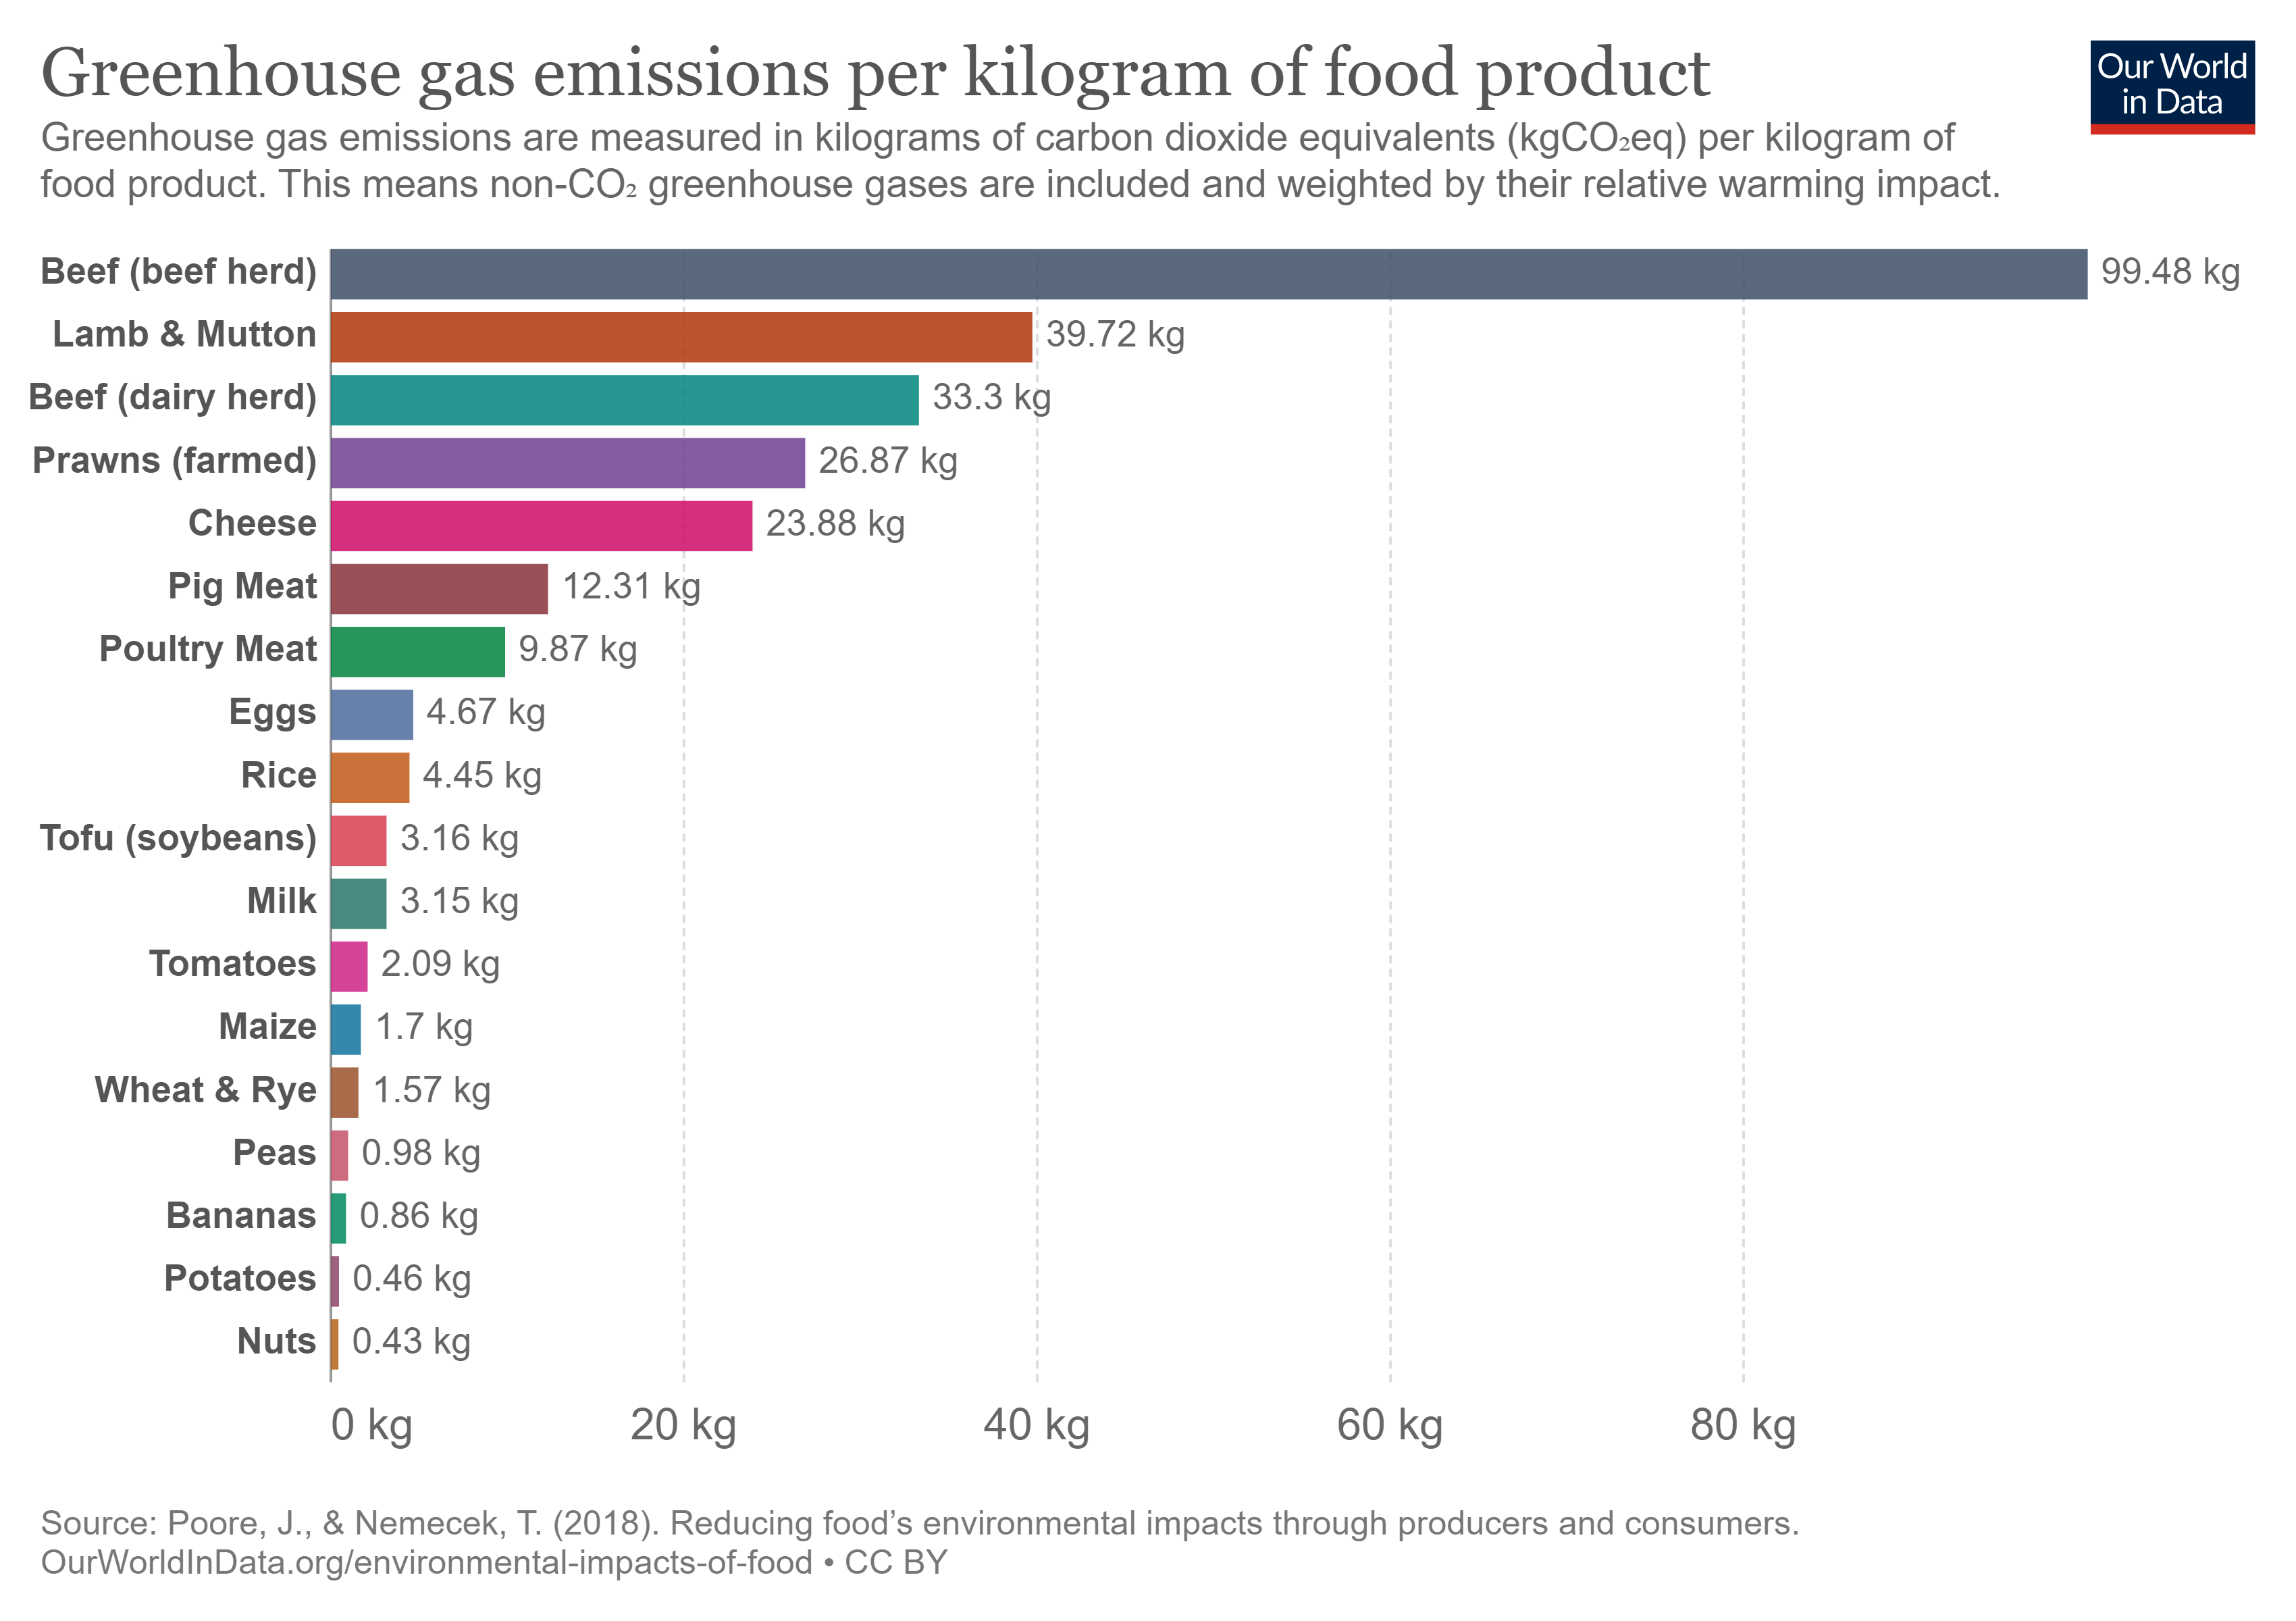
Resulted greenhouse gas emissions are finally calibrated using OurWorldInData global Food Grenhouse gas emissions [^17]. We consider only emissions from Crops and Livestock as all supply chain and lan use emissions are computed elsewhere.
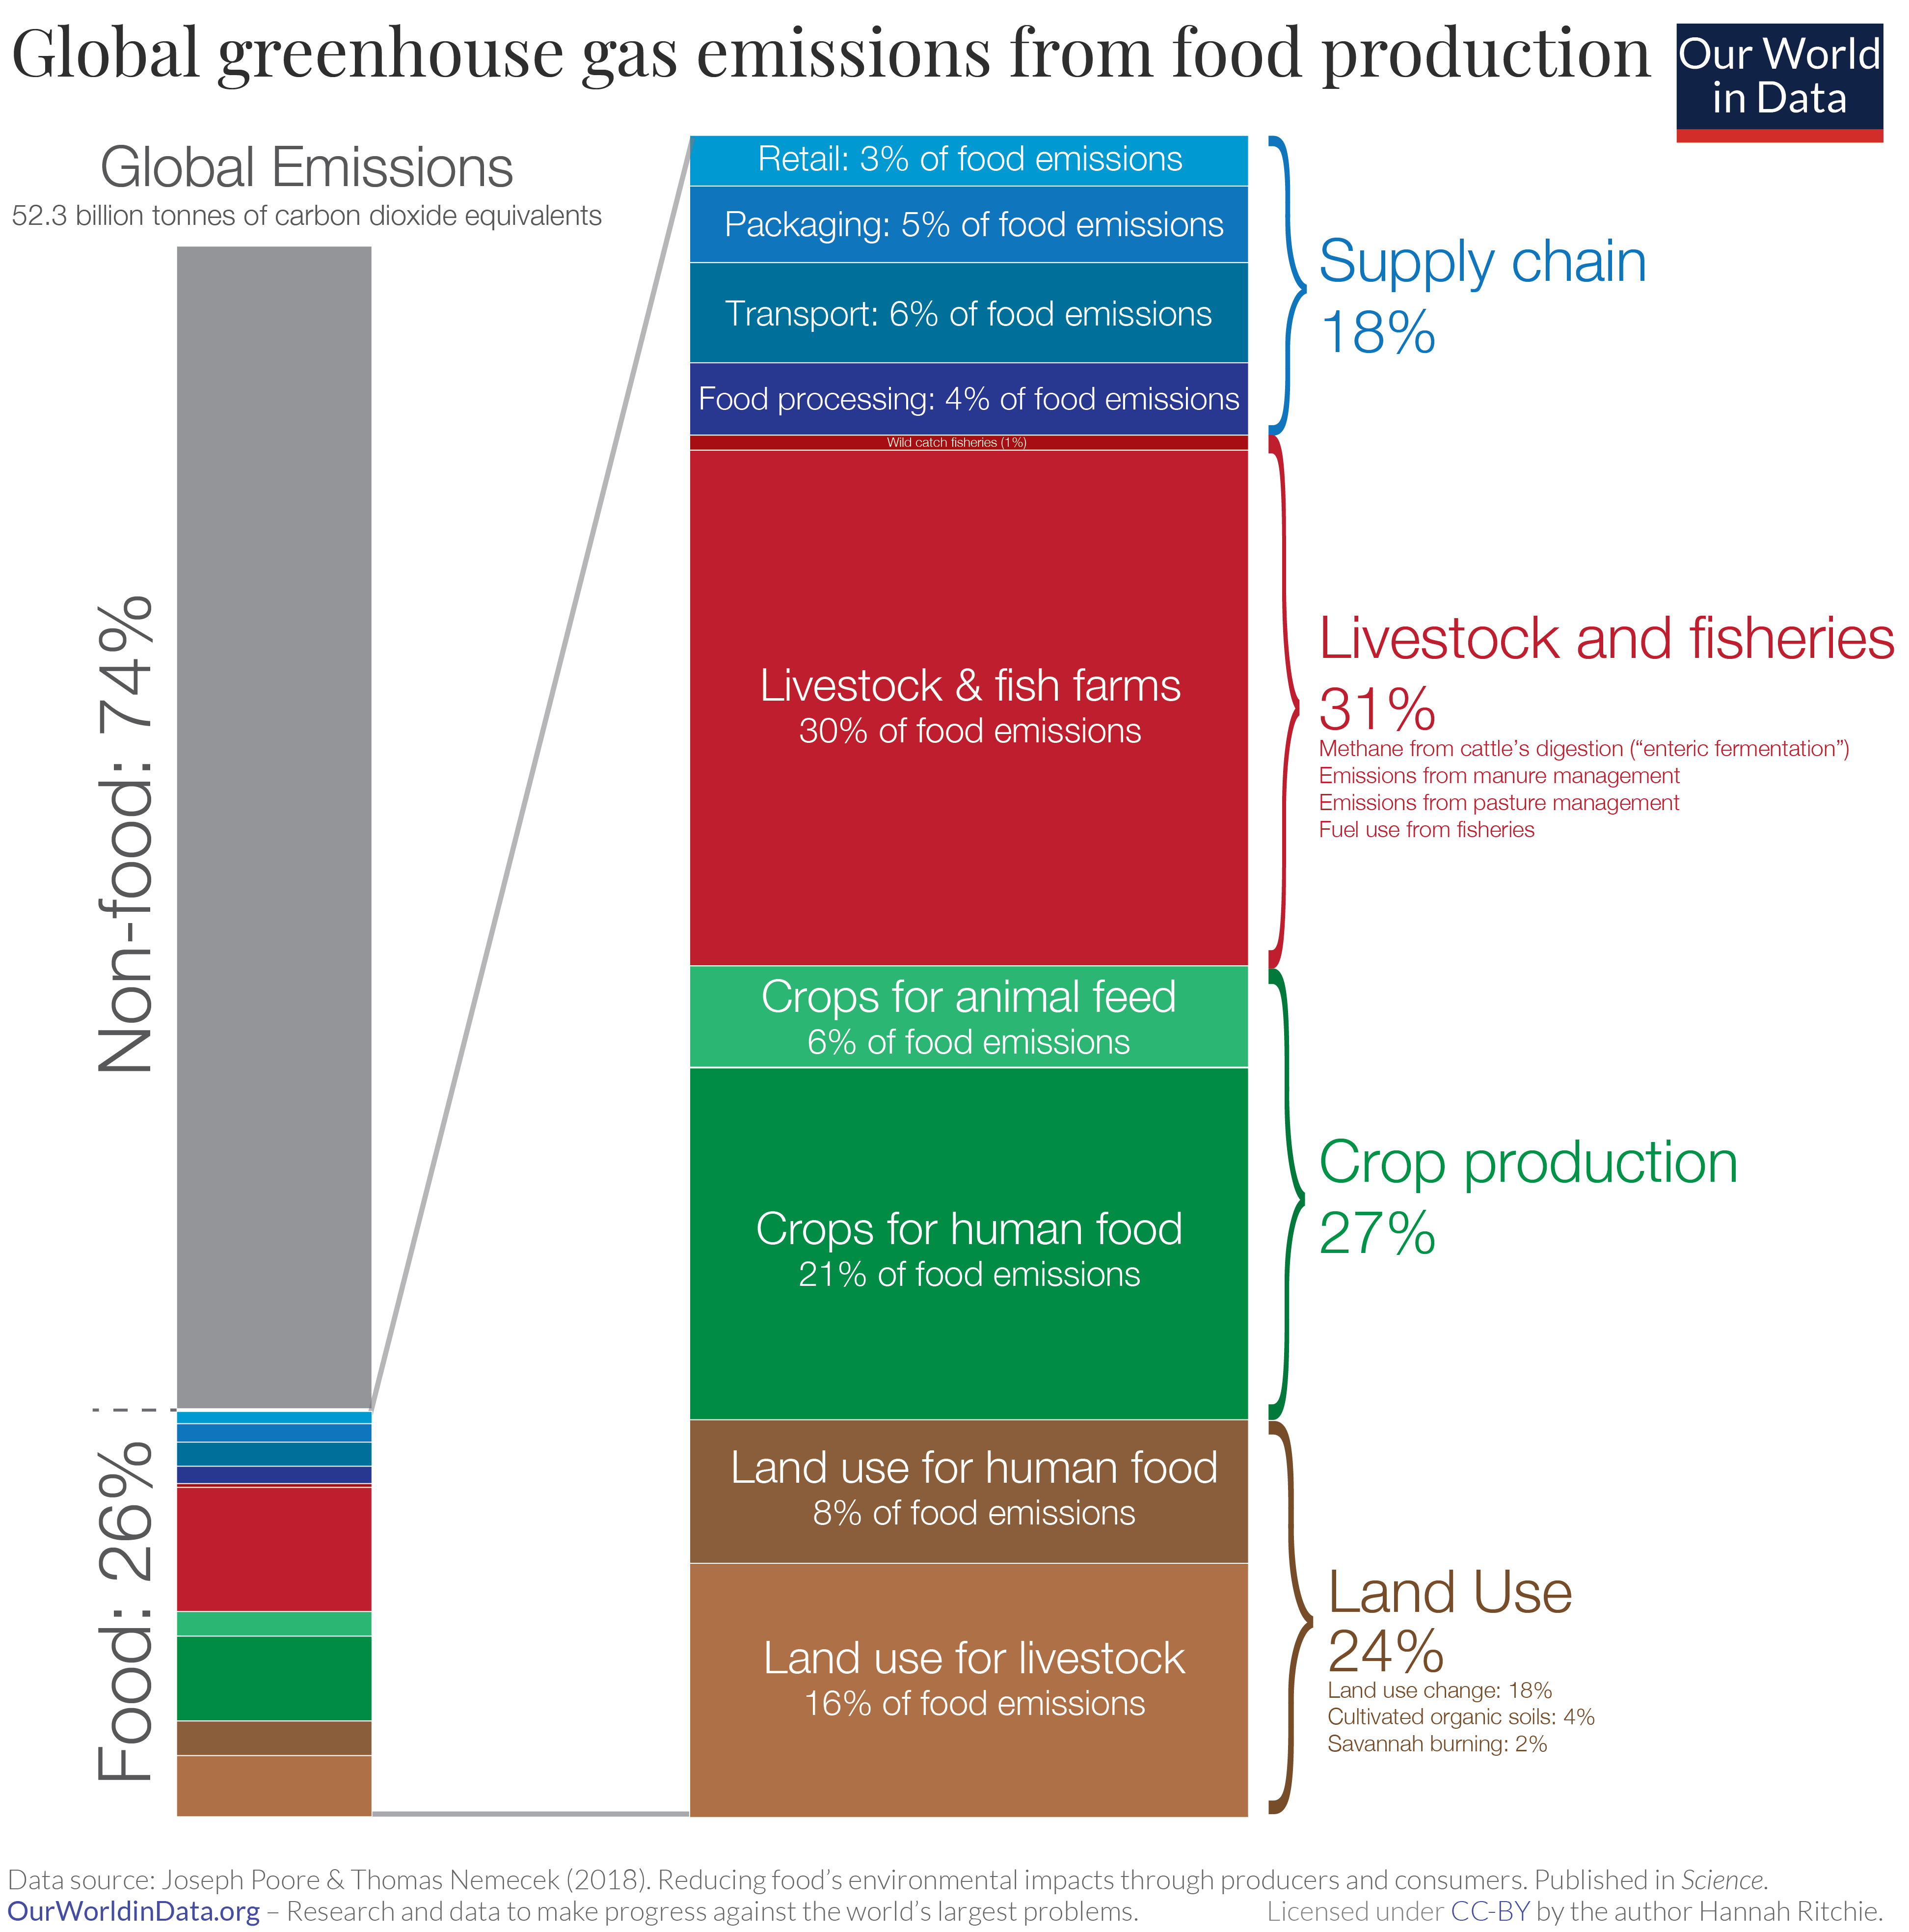
Note that each of those sources deal with CO2eq emissions of all greenhouse gases. From OurWorldInData: Carbon footprint and methane [^19], we are able to identify the CH4 part in these global GHG emissions. Nitrous Oxide emissions (N20) are extracted from FAO Stats from 2019 [^20]. All calibrations are also done using the total emissions given by the FAO.
Results
This sections aims to describes the results charts.
- Surface taken to produce food over time: This is a bar graph, displaying the surface needed (Gha) over the time (years of the study). The detail is given for each food considered. Plus, a line plots the total surface needed to feed humanity, with the considered diet.
- Share of the surface used to produce food over time: This graph display the same information than the last one, but values are normalized in percentage.
- evolution of the diet overtime: This graphs gives the diet evolution for each year of the study, in kg / person / year, for each food.
Model limitation
This section aims to gives the limitations of the model.
The agriculture model gives output data as the result of different computations described previously. However, the different hypothesis lead to limitations that should be kept in mind in order to have a critical point of view regarding results. The following points list the limitations of the agriculture model:
- The model does not allow a modification of the global kcal amount of the diet. This kcal amount is set by the initial diet, and will remain the same.
- The model does not test the feasibility of the diet change. For example, convert 100% of red meat or white meat in one year is allowed in the model, even if it is probably not realisable.
- The model considers a global average diet, and does not include change depending on country or habits.
- The land use to produce food are assumed to be able to produce any type of food, without regarding average weather or climate conditions. For example equatorial or temperate climate may have different affinity with food production.
Example of diet
This section gives example of diet data that can be used as diet_df input. Data are extracted from [^7], and are given in kg/person for the year 2018
|Region|Red meat|White meat|Milk|Eggs|Rice and Maize|Potatoes|Fruit and vegetables|Unit|Year| | ---- | ------ |:--------:|----|----|:------------:|:------:|:------------------:|----|----| |World|11.02|31.11|79.27|9.68|97.76|32.93|217.62|kg/person|2018| |USA|37.7|84.63|223.7|16.21|22.99|52.26|203.07|kg/person|2018| |China|8.97|52.51|23.13|19.74|125.47|41.9|463.29|kg/person|2018| |France|23.43|54.44|185|211.72|20.06|49.18|181.92|kg/person|2018|
Biomass dry Production
Initial production: production of energy crop in 2020.
Initial_production=4.9 Gha of agricultural lands * density_per_ha * 3.36 kWh/kg calorific value * crop_percentage_for_energy
The model computes the crop energy production and then add the residue production part for energy from the surface for food.
Then :
Land use
The computed land-use amount of hectares is the agricultural area for energy crops (only the crop part) with the following computation:
With: - CropProductionForEnergy, the production of crop and residue for energy sector computed by this model
Costs
For CAPEX computation: - crop production: 237.95 €/ha (717$/acre)[^15]
For OPEX computation: - crop harvest and processing: 87.74 €/ha (264.4$/acre)[^15] - residue harvest (22$/t) + fertilizing (23$/t): 37.54 €/ha[^16]
The computed price is the mixed price of crop and residue. Details in the composition of prices of crop and residue is shown in the graphics named "Detailed Price of energy crop technology over the years". Prices are computed with the input parameter crop_residue_price_percent_dif.
References
[^1]: OurWorldInData, land use over the long term, https://ourworldindata.org/land-use#agricultural-land-use-over-the-long-run [^2]: MDPI, Crop Residue Removal: Assessment of Future Bioenergy Generation Potential and Agro-Environmental Limitations Based on a Case Study of Ukraine, https://www.mdpi.com/1996-1073/13/20/5343/pdf [^3]: World Bioenergy Association, Global Energy Statistics 2019, http://www.worldbioenergy.org/uploads/191129%20WBA%20GBS%202019_HQ.pdf [^4]: World Bioenergy Association, Global biomass potential towards 2035, http://www.worldbioenergy.org/uploads/Factsheet_Biomass%20potential.pdf [^5]: Bioenergy Europe, Biomass for energy: agricultural residues and energy crops, https://bioenergyeurope.org/component/attachments/attachments.html?id=561&task=download [^6]: The world bank, Cereal yield kg per hectare, https://data.worldbank.org/indicator/AG.YLD.CREL.KG [^7]: FAO, FAOSTAT, Food Balances (2014-), Latest update: April 14 2021, Accessed August 2021, http://www.fao.org/faostat/en/#data/FBS [^8]: Poore, J., & Nemecek, T. (2018). Reducing food's environmental impacts through producers and consumers. Science, 360(6392), 987-992. Published online at OurWorldInData.org. Retrieved from: https://ourworldindata.org/grapher/land-use-per-kg-poore [^9]: FAO, Food Balance Sheets A handbook, Annex 1 : Food Composition Tables, http://www.fao.org/3/X9892E/X9892e05.htm#P8217_125315 [^10]: Knoema, Production Statistics - Crops, Crops Processed, https://knoema.com/FAOPRDSC2020/production-statistics-crops-crops-processed?country=1002250-world [^11]: IPCC, 2007. Climate Change 2007: Impacts, Adaptation and Vulnerability Contribution of Working Group II to the Fourth Assessment. Report of the Intergovernmental Panel on Climate Change, M.L. Parry, O.F. Canziani, J.P. Palutikof, P.J. van der Linden and C.E. Hanson, Eds., Cambridge University Press, Cambridge, UK, 976pp. [^12]: FAO, 2019. The State of Food and Agriculture 2016 (SOFA): Climate Change, Agriculture and Food Security. [^13]: Rosenzweig, C., Elliott, J., Deryng, D., Ruane, A.C., Müller, C., Arneth, A., Boote, K.J., Folberth, C., Glotter, M., Khabarov, N. and Neumann, K., 2014. Assessing agricultural risks of climate change in the 21st century in a global gridded crop model intercomparison. Proceedings of the national academy of sciences, 111(9), pp.3268-3273. [^14]: Schleussner, C.F., Deryng, D., Muller, C., Elliott, J., Saeed, F., Folberth, C., Liu, W., Wang, X., Pugh, T.A., Thiery, W. and Seneviratne, S.I., 2018. Crop productivity changes in 1.5 C and 2 C worlds under climate sensitivity uncertainty. Environmental Research Letters, 13(6), p.064007. [^15]: Manitoba, Crops production costs - 2021, gov.mb.ca/agriculture/farm-management/production-economics/pubs/cop-crop-production.pdf [^16]: United States Department of Agriculture, 2016, Harvesting Crop Residue: What’s it worth?, https://www.nrcs.usda.gov/Internet/FSE_DOCUMENTS/nrcseprd1298023.pdf [^17]: OurWorldInData: Food Grenhouse gas emissions, https://ourworldindata.org/food-ghg-emissions [^18]: OurWorldInData: Environmental impacts of food, https://ourworldindata.org/environmental-impacts-of-food#co2-and-greenhouse-gas-emissions [^19]: OurWorldInData: Carbon footprint and methane, https://ourworldindata.org/carbon-footprint-food-methane [^20]: Food and Agriculture Organisation, World Statistics, https://www.fao.org/faostat/en/#data/FBS [^21]: Food and Agriculture Organisation, World Statistics, https://www.fao.org/faostat/en/#data/GT